by Moin Islam11 min read
The 12 delivery performance metrics that predict profitability (and how to track them)

It's 7:12 on a Friday night. Six drivers are on the road, 14 orders sit on the screen, and a customer wants to know why dinner hasn't moved in 20 minutes. The map shows dots — not whether the kitchen ran late, dispatch held the order, the route was bad, or the shift took on more than it could handle.
As the adage goes, what gets measured gets managed, and you need to start by asking the right questions. Are orders arriving on time? Are you using your drivers well? Does each delivery earn enough to cover its cost? Every answer points to a decision: add a driver, tighten a zone, change a route, fix dispatch, or stop subsidizing an order.
Use the ranges below as benchmarks — delivery windows, route density, products, geography, and fleet model all change the result. APQC reports a median perfect-order rate of 88% across 13,590 organizations, combining on-time, complete, damage-free, and accurately documented orders. Start with a few weeks of your own data and tighten from there.
1. On-time delivery rate
On-time delivery rate is the percentage of completed orders that arrive inside the promised window. This is the first one you’re going to want to track. Late orders expose problems in prep, dispatch, routing, and driver execution.
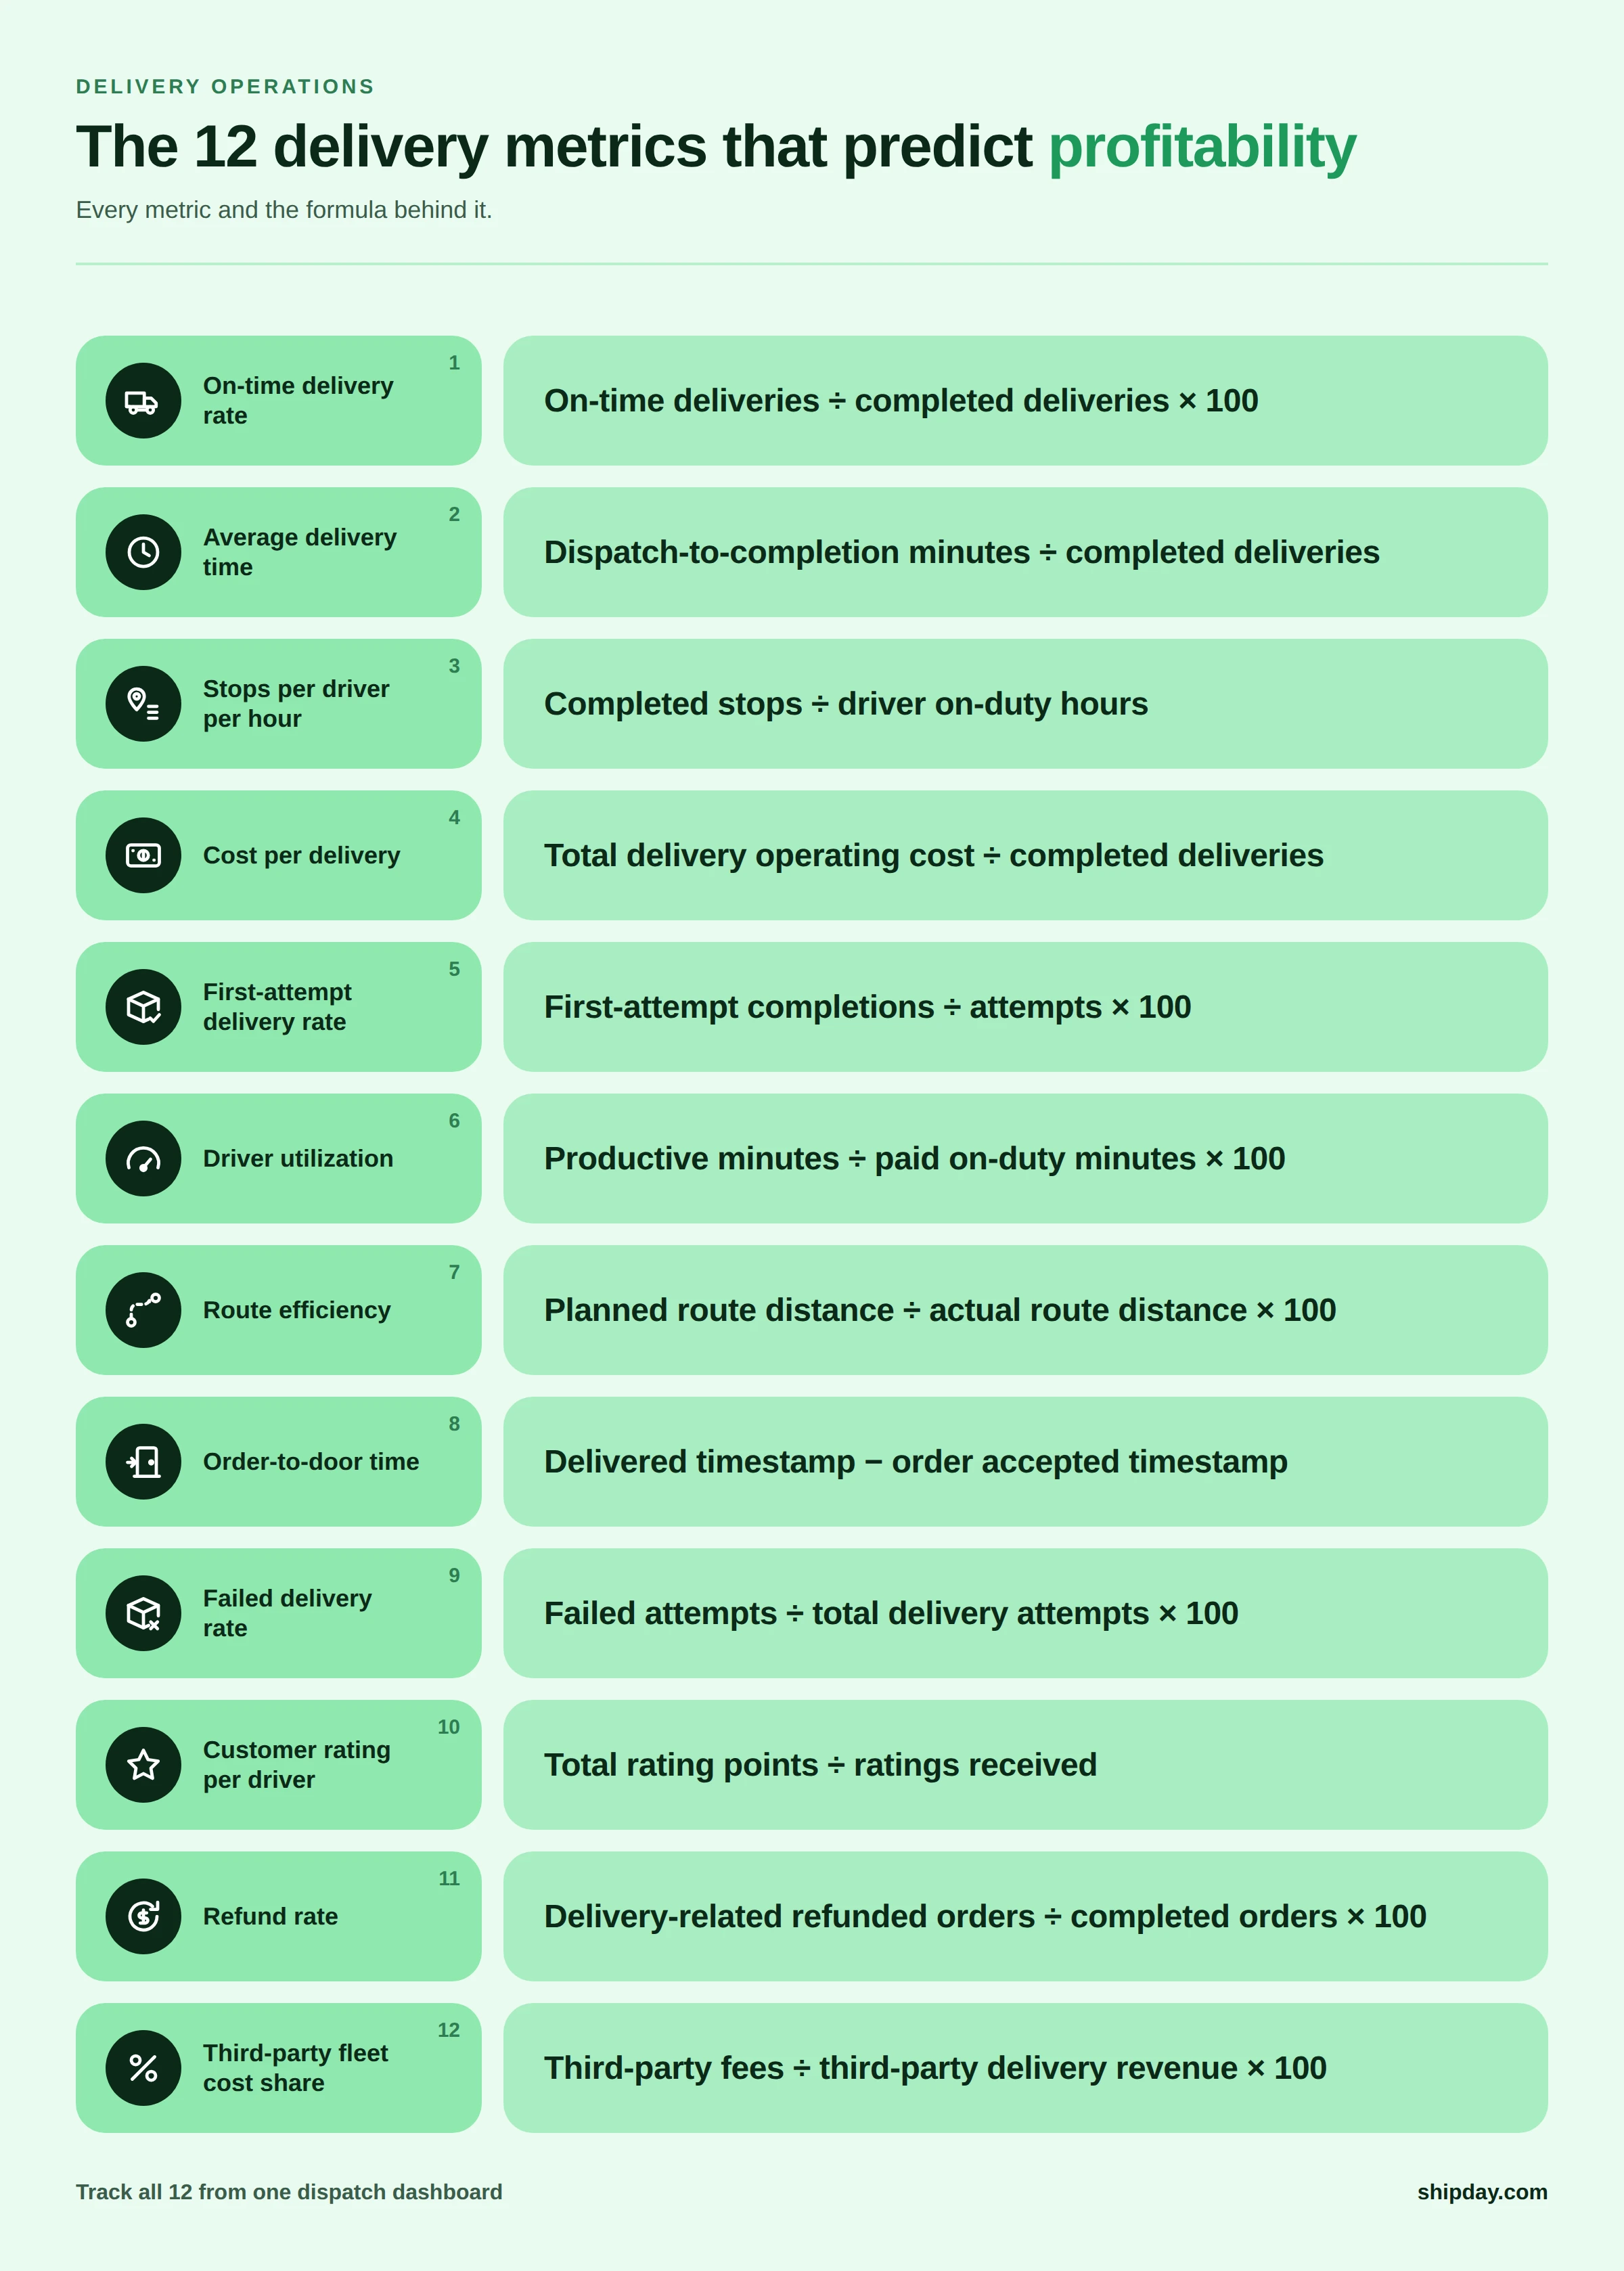
Formula: On-time deliveries ÷ completed deliveries × 100
Benchmark: 95% or higher; investigate anything below 90%. Stable, scheduled routes should reach 97%. Tusk Logistics reported 95.5% on-time delivery across tens of thousands of alternative-carrier shipments in April 2026. Compare the actual completion timestamp with the customer promise. A restaurant's 35-minute window and a big-box store’s Tuesday-morning window use the same math.
2. Average delivery time and average time per stop
Simply, the total time the delivery leg takes. Average time per stop is the time a driver spends at each destination. Be sure to keep them separate, or what was just a slower-than-normal handoff may look like a bigger problem.
Formulas: Total dispatch-to-completion minutes ÷ completed deliveries; total service minutes at stops ÷ completed stops
Benchmarks: 20–45 minutes for local on-demand delivery and 3–10 minutes at a routine residential stop.
When you measure, don’t blend the numbers together. It’ll make the bottleneck harder to spot. Split the averages by zone, hour, order type, and driver for easier filtering.
3. Stops per driver per hour
Stops per driver per hour is the number of deliveries a driver completes during paid time — a quick read on whether a route has enough orders to support its labor.
Formula: Completed stops ÷ driver on-duty hours
Benchmark: 2–4 stops per hour for on-demand local delivery and 4–8 for dense, preplanned routes. Rural or complex routes can fall below these ranges without being inefficient.
Compare like with like. Apartment signatures and porch drops are different work.
4. Cost per delivery
Cost per delivery is your total delivery operating cost divided by completed deliveries — the test of whether delivery revenue covers the work required to earn it.
Formula: (Driver wages + payroll burden + mileage or vehicle cost + insurance + software + third-party fleet fees + delivery supplies) ÷ completed deliveries
Benchmark: No universal dollar figure works across delivery models. Keep the cost below the delivery revenue plus the product profit allocated to delivery, leaving money for overhead. Bringg's 2026 survey of 150 enterprise executives found 64% of companies missed their own cost-per-delivery targets — its weakest KPI result.
Calculate in-house and third-party deliveries separately. A low software bill can't rescue a route with poor density.
5. First-attempt delivery rate
First-attempt delivery rate is the percentage of orders completed without a return visit or reschedule. Every failed attempt repeats part of the route without creating another sale.
Formula: Deliveries completed on the first attempt ÷ deliveries attempted × 100
Benchmark: 95% or higher for local delivery; 98% or higher for attended appointments. Parcel Perform's e-commerce logistics report recorded a 97% first-attempt delivery rate. Parcel carriers can leave more orders unattended than food, alcohol, or B2B drivers — compare with care.
Tag the failure reason. Bad addresses, unavailable recipients, restricted-product refusals, and merchant errors need different fixes.
6. Driver utilization and idle time
Driver utilization is the amount of paid time a driver spends traveling to or serving a stop. Idle time is everything left over.
Formulas: Productive minutes ÷ paid on-duty minutes × 100; idle minutes ÷ paid on-duty minutes × 100
Benchmark: 70–85% utilization across a shift. Above 90% can indicate insufficient recovery capacity; below 60% can indicate low density, poor scheduling, or excess staffing.
Exclude approved breaks and separate controllable idle time from dispatch wait. Drivers can't fix an upstream delay.
7. Route efficiency
Route efficiency compares your planned distance with the distance a driver actually covers. It exposes detours, weak plans, and mid-route changes that delivery time alone can't explain.
Formula: Planned route distance ÷ actual route distance × 100
Benchmark: 90–100%. A result above 100% can occur when a driver finds a shorter path; a result below 85% warrants a route-level review.
Use the route published at dispatch as the plan. OptimoRoute and Onfleet expose planned-versus-actual reporting on some tiers.
8. Order-to-door time
Order-to-door time measures the customer's entire wait. Split it into prep time, dispatch wait, and drive time to see where the delay starts.
Formula: Delivered timestamp − order accepted timestamp.
Components: Prep = ready − accepted; dispatch wait = departure − ready; drive = delivered − departure
Benchmark: Set the total to the promise shown at checkout. Dispatch wait should stay under 10 minutes and shouldn't exceed prep time across shifts.
If drivers are fast but orders are late, routing isn't the first problem. The clock started before the keys turned.
9. Failed delivery rate and reasons
Failed delivery rate is the percentage of attempts your drivers don't complete. Require a reason code for every failure, or the number won't tell you what to fix.
Formula: Failed delivery attempts ÷ total delivery attempts × 100
Benchmark: Below 2%; below 1% for repeat routes with validated addresses.
Review the top three causes each week: address failures may need checkout validation, "customer unavailable" may need tighter ETA notifications, and merchant-not-ready failures belong upstream.
10. Customer rating and review volume per driver
Customer rating tells you what customers thought of the delivery. Review volume tells you whether to trust the score — a 5.0 from two reviews says less than a 4.8 from 80.
Formulas: Total rating points ÷ ratings received; ratings received ÷ completed deliveries × 100
Benchmarks: 4.7 or higher, with feedback on at least 10–20% of completed deliveries.
Set a minimum response threshold before ranking drivers. Shipday's reports and AI insights link a score to recurring complaints rather than treating stars in isolation.
11. Refund rate
Delivery-related refund rate is the percentage of completed orders you refund for late delivery, damage, missing items, the wrong address, or non-delivery. It shows what those service failures cost.
Formula: Delivery-related refunded orders ÷ completed orders × 100
Benchmark: Below 1%; investigate anything above 2%.
Keep delivery refunds separate from product-quality refunds and cancellations, and track refunded dollars as well as order count.
12. Third-party fleet cost as a percentage of delivery revenue
A third-party fleet cost percentage shows how much delivery income goes to outsourced drivers — whether overflow protects your profit or eats into it.
Formula: Third-party delivery fees ÷ delivery revenue from third-party-fulfilled orders × 100
Benchmark: Below 70–80% if delivery revenue alone should cover fulfillment. A ratio above 100% means the business subsidizes delivery before product margin enters the calculation.
This number needs the provider invoice and revenue to be attached to the same orders. Dispatch software identifies the order; accounting does the rest.
Which metrics should delivery software calculate for you?
Your delivery software should calculate on-time rate, delivery time, stop time, stops per hour, first attempts, driver time, planned-versus-actual distance, failed deliveries, ratings, and provider-level order counts. Dispatch timestamps, GPS records, and proof-of-delivery records already contain the data.
A spreadsheet still has to combine the financial data the platform doesn't own: payroll, insurance, vehicle costs, refunds, provider invoices, and delivery revenue.
Shipday's reporting tools cover driver, performance, refund, feedback, and third-party delivery reports, with API access on paid plans. The guide to improving operational efficiency covers how routing, dispatch, and tracking change those results.
How delivery-platform reporting compares in 2026
Delivery platforms differ most in dashboards, retention, exports, and access to raw data. “Reporting included” can mean a dashboard, a spreadsheet, or an API — not the same thing.
| Platform | Built-in dashboard | Raw export | API | Published history/retention | Per-driver breakdown | Scheduled reports | Public starting price (as of 8/20) |
|---|---|---|---|---|---|---|---|
| Shipday | Yes; driver, performance, refund, feedback, heatmap, and third-party reports | PDF/spreadsheet | Yes, paid plans | n/a | Yes | Not publicly documented | Free up to 300 orders/mo; Professional starts at $39/mo. Average omitted because Shipday pages conflict. |
| Onfleet | Yes; customizable analytics and route analytics | CSV | Yes | 90 days Launch, 1 year Scale, lifetime Enterprise | Yes | Scheduled route snapshots; scheduled report delivery not publicly documented | Launch $619/mo for 2,500 tasks |
| Spoke Dispatch | Yes; operational reporting | Historic driver analytics export on upper tier | Public API and webhooks | Not publicly documented | Yes; historic export restricted by tier | Not publicly documented | No current public price verified on an official Spoke page |
| Track-POD | Yes; customizable analytics | Excel / CSV / PDF | Yes | 2 years on listed tiers; unlimited on Enterprise | Yes | Notifications can be scheduled; report delivery not publicly documented | Advanced $59/driver/mo monthly, 3-driver minimum |
| Detrack | Yes; job, failure, mileage, capacity, and milestone reports | Excel / CSV / PDF | Yes | Advanced reporting shows up to 30-day breakdowns; some records can be stored up to 5 years | Yes | Not publicly documented | Pro $29/vehicle/mo; Advanced $39/vehicle/mo |
| OptimoRoute | Yes on Pro and Custom | Excel | Yes | Route history included; duration not publicly documented | Yes | Not publicly documented | Lite $35.10/driver/mo annually; Pro $44.10 |
| Routific | Yes; routes, orders, distance, working time, and driver stats | CSV | Yes | Export limits and date-range guidance vary across current help pages | Yes | Not publicly documented | Free up to 100 orders/mo; $150/mo up to 1,000 |
No platform calculates every profitability metric. Shipday serves small operators who use in-house and third-party drivers. Onfleet publishes clear retention tiers; Track-POD documents its data history. OptimoRoute and Routific focus on route performance, while Detrack offers a wide range of reports at a lower per-vehicle price. Spoke Dispatch publishes fewer buying details.
How to run a weekly delivery metrics review
A weekly delivery review should take 30 minutes and end with one owner, one action, and one number to watch. Pull the same 12 metrics against your 4-week baseline and break each miss down by location, zone, shift, driver, order source, and fleet type.
Start with money — cost per delivery, refunds, third-party cost percentage — then diagnose the cause through on-time rate, order-to-door components, utilization, route efficiency, and failure reasons. Review driver-level ratings only after applying a minimum sample.
Change one rule at a time — staffing, delivery radius, prep handoff, dispatch timing, or route design — and check the result the following week. A dashboard full of red numbers is noise until one of them changes Monday's schedule.
Frequently asked questions
Which delivery management software has the best performance metrics?
Onfleet and Track-POD publish the deepest reporting detail. Shipday gives small businesses driver, refund, feedback, and third-party fleet reporting without an enterprise price tag.
What is a good on-time delivery rate?
95% or higher, measured against the delivery window promised at checkout. Scheduled, repeatable routes should reach 97%; anything below 90% signals a problem in prep, dispatch, routing, or driver capacity.
How do you calculate cost per delivery?
Add driver wages, payroll burden, mileage or vehicle costs, insurance, software, supplies, and third-party fees, then divide by completed deliveries — in-house and outsourced calculated separately. The result should sit below delivery revenue plus allocated product margin, or each order grows sales while shrinking profit.
How many deliveries should a driver complete per hour?
2–4 completed stops per driver per hour for local on-demand delivery; dense, preplanned routes can support 4–8 stops per hour. Rural mileage, apartments, and wait time all cut into that number.
What delivery KPIs should a small business track?
Start with five: on-time delivery rate, cost per delivery, stops per driver per hour, failed delivery rate, and refund rate. Add order-to-door time when prep is part of the operation, and third-party cost percentage once outsourced drivers handle overflow.

Moin IslamCo-founder, CEO
Automating local deliveries globally. Writes about restaurant delivery management, growing delivery business, and managing profitable restaurants.